Experiment 4: Maximum Power Point Tracking (MPPT) for Photovoltaic Systems
Introduction
From the I-V curve and P-V curve for a PV module in Figure 1, we can identify several important parameters including the open-circuit voltage Voc, and the short-circuit current Isc. The product of the voltage and current is the power delivered by the PV module. The output power is zero at the two ends of the I-V curve because either voltage or current is zero at those points. The maximum power point (MPP) is at the knee of the I-V curve where the product of voltage and current reaches the maximum. In Figure 1, it shows the voltage at maximum power point (MPP) is VR, and the current at MPP is IR. We’d like to have the PV module operate at MPP to extract the highest amount of power from it.
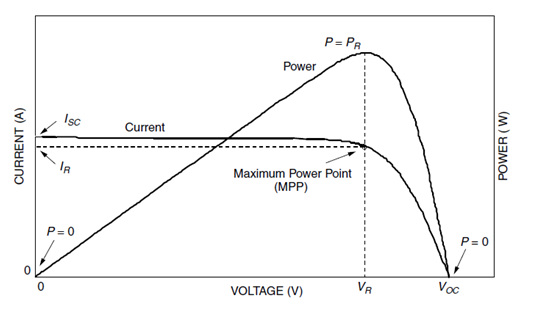
Figure 1. I-V curve and P-V curve for a PV module
The I-V characteristics of PV modules will vary with different irradiance and temperature. That means the maximum power point will vary in real time. Figure 2 shows the general MPPT control block diagram. The input of the DC-DC converter is connected to a solar panel. Its output is connected to a load.
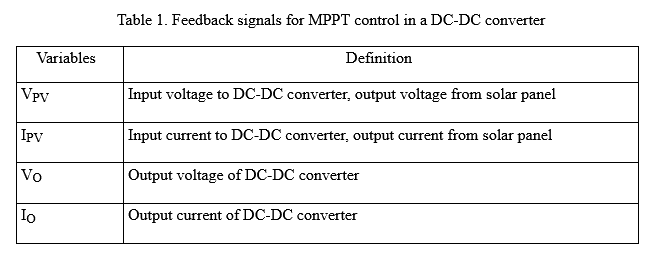
The MPPT controller takes feedback from PV voltage VPV, PV current IPV, output voltage VO and current IO from DC-DC converter, then uses different control algorithms to calculate duty cycle for the DC-DC converter. Table 1 shows the feedback signal for the controller. The control algorithm will automatically adjust the duty cycle to move the PV voltage and current to make it operate at the maximum power point, extracting the maximum available power.
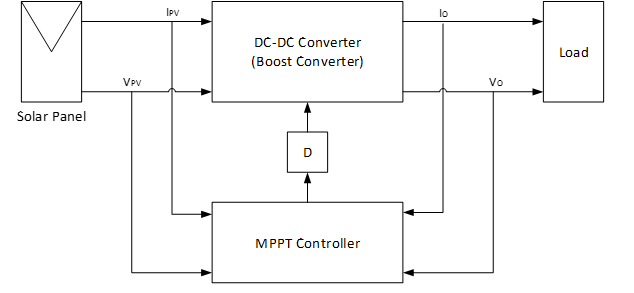
Figure 2. MPPT control for a solar panel
The most commonly used MPPT control algorithms are Perturb and Observe (P&O) and Incremental Conductance.
Perturb and Observe (P&O) control algorithm
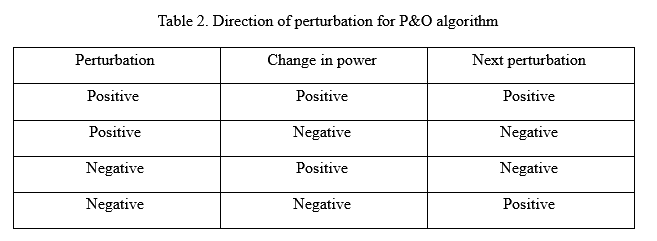
The perturb and observe method measures the PV module’s output voltage and current, and then perturbs the operating point to determine the change direction. From the P-V curve in Figure 1, we can see when operating on the left of the MPP, incrementing the voltage increases the power, and decrementing the voltage decreases the power. On the other hand, when operating on the right of the MPP, incrementing the voltage decrease the power, and decrementing the voltage increases the power. Therefore, if there is an increase in power, the subsequent perturbation should be in the same direction to reach the MPP. If there is a decrease in power, the perturbation should reverse direction to reach the MPPT. Figure 3 Shows the flowchart for P&O control algorithm. Table 2 shows how to determine the direction of next perturbation.
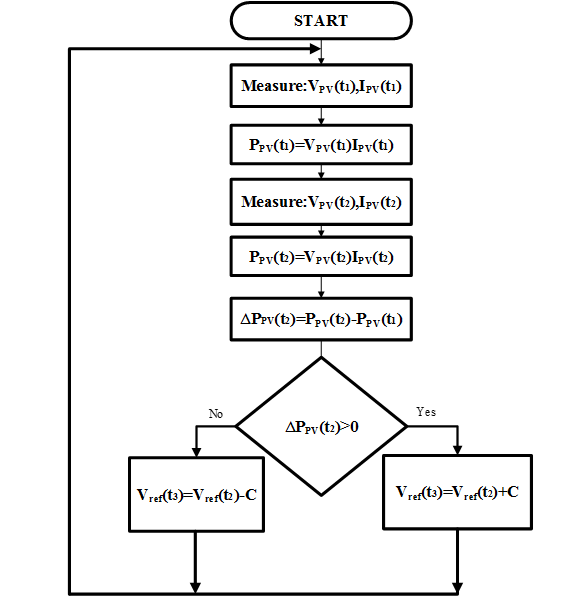
Figure 3. Perturb and observe control algorithm
Incremental Conductance control algorithm
The incremental conductance algorithm is based on the fact that the slope of the P-V curve is zero at the MPP, positive on the left of the MPP, and negative on the right. Flowchart of the incremental conductance control algorithm is shown in Figure 4.
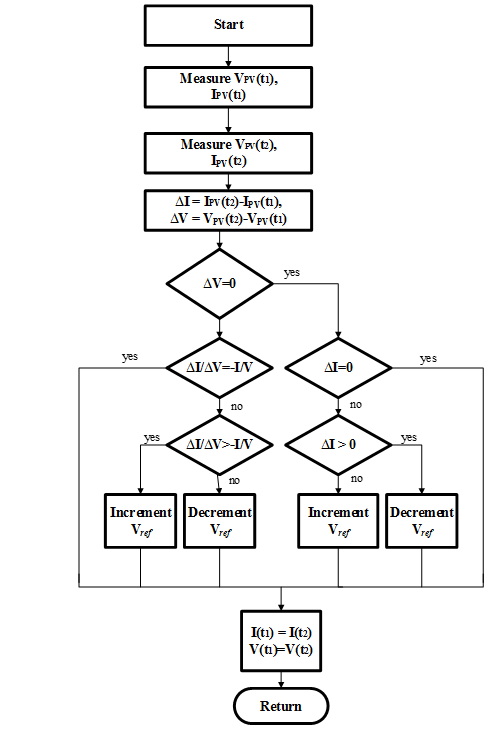
Figure 4. Incremental Conductance control algorithm
- Maximum power point for PV
- Feedback control for maximum power point tracking (MPPT)
- MPPT controller algorithms
- Operation of MPPT control
- Solar Panel
- DC-DC converter
- Rechargeable Battery
- Controller
- Connect the blocks for MPPT control.
- Complete the flowchart for Perturb & Observe (P&O) control algorithm for MPPT.
- Complete the flowchart for Incremental Conductance control algorithm for MPPT.
- Give the value of 1000 W/m2 to irradiation, and value of 25 ℃ to temperature.
- Start the MPPT control. Observe the solar panel’s output voltage, current and power.
- Plot the IV curve and identify the maximum power point on the IV and PV curve.
- Compare the voltage, current and power from the MPPT control with the values of maximum power point on IV and PV curve.
- Repeat the MPPT control for irradiation from 800 to 1200 W/m2 with an interval of 100 W/m2
- Verify the MPPT control is able to reach the maximum power point when irradiation changes.
- Display the block diagram for MPPT control.
- Display the flowchart for Perturb & Observe control algorithm for MPPT
- Display the flowchart for Incremental Conductance control algorithm for MPPT
- Display the IV and PV curve with each irradiation. Mark the maximum power point on the curve.
- Display the output voltage, current and power for MPPT control. Compare with the maximum power point on the IV curve, and verify if the MPPT controller can operate the solar panel at the maximum power point for each irradiation.
Contact Us
Virtual Renewable Energy Laboratory
Principal Investigator:Liping Guo, Ph.D.
815-753-1350
lguo@niu.edu
Co-Principal Investigator:
Andrew W. Otieno, Ph.D.
815-753-1754
otieno@niu.edu
The project is funded by the
National Science Foundation
Improving Undergraduate STEM Education program (DUE-1712146)
from June 2017 to May 2020.