Experiment 3: Data Acquisition for Renewable Energy Systems
IntroductionThe global supply of electrical energy is from conventional sources with the fossil fuels as the leading source. Currently the most common fuel used in the United States for electricity production is coal. The continued growth in the demand for energy consumption worldwide has led to an increase in carbon emissions, which have significant effects on climate change. There is an urgent need for clean and renewable energy sources that have significantly less impacts on the global climate.
Wind and solar are the two main sources of renewable energy. Photovoltaic (PV) cells are semiconductors which become electrically conductive on exposure to light or heat. Multiple cells are connected to have a solar module, and multiple modules can form a solar panel. Solar panels have an efficiency of only about 10%.
Output voltage of solar panel will vary with different irradiance, angle to the sun and output current. A data acquisition system (DAQ) is very effective to monitor and log the output of a solar panel as it varies during the day. A DAQ system include sensors, signal conditioning, analog-to-digital converters (ADC) and programmable software. Figure 1 shows a DAQ system. It reads analog signals, then use signal conditioning and analog-to-digital converters (ADC) to convert the signal into digital signals.
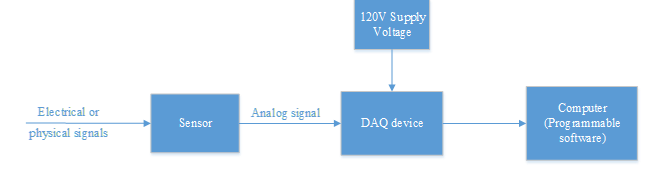
Figure 1. DAQ system
Most commercial wind turbines have 3 blades. DAQ can also be used to monitor wind power systems. A typical DAQ system that monitors electrical power from a wind turbine will require 120 V to operate its electronics.
- Understand DAQ system structure.
- Study a real time data monitoring and logging for a solar power system.
- Connect the DAQ for a renewable energy system. Refer to Figure 1.
- The following web site has real time data monitoring for the solar power system on the roof of Still Hall. Browse the web site and study Overview tab on the top left corner. Link
- Click on Analysis tab on the top left corner, and then click on History. Select the device Primo3.8-1 208-240(#1). Under Channels, select Current DC MPP1 and Voltage DC MPP1 to plot the current and voltage waveform during the day. Observe how they vary during the day.
- Unselect Current and Voltage. Select Total Power to plot the power waveform during the day. Observe how the total power vary during the day.
- Display the current and voltage waveform during the day. Describe how the current and voltage vary during the day.
- Display the power waveform during the day. Describe how the power vary during the day.
Contact Us
Virtual Renewable Energy Laboratory
Principal Investigator:Liping Guo, Ph.D.
815-753-1350
lguo@niu.edu
Co-Principal Investigator:
Andrew W. Otieno, Ph.D.
815-753-1754
otieno@niu.edu
The project is funded by the
National Science Foundation
Improving Undergraduate STEM Education program (DUE-1712146)
from June 2017 to May 2020.