- Home
- Experiments
- 2 - Series and Parallel Connections of Solar Cells
Experiment 2: Series and Parallel Connections of Solar Cells
Introduction
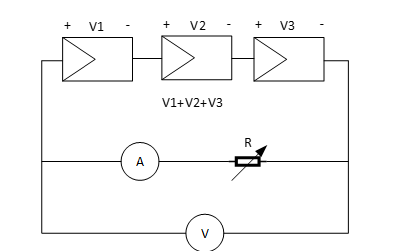
Solar cells can be connected in series to increase the output voltage, shown in Figure 1. Total voltage is equal to the sum of individual voltages. Solar cells in series are termed string. Because solar cells are not perfectly identical, the total current flowing through a string is equal to the lowest value of the solar cell.

Figure 1: Solar Modules in Series Connection
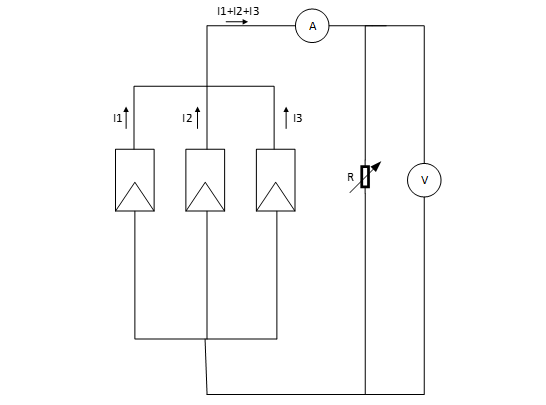
Connecting cells in parallel increases the total current, shown in Figure 2. Total current is equal to the sum of individual currents.

Figure 2: Solar Modules in Parallel Connection
- Recording voltage and current characteristics of a single solar cell
- Recording voltage and current characteristics of solar cells in series.
- Recording voltage and current characteristics of solar cells in parallel.
- Solar Cells
- Potentiometer
- Voltage Meter
- Current Meter
- Set the irradiance to 1000 W/m2, and temperature to 25 ℃.
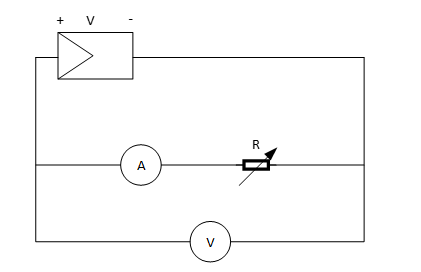
- Connect the solar cell to a potentiometer shown in Figure 3. Connect the voltage meter in parallel with the solar cells, and the current meter in series to measure the output voltage and current respectively.
- Vary the value of the potentiometer sequentially according to Table 1. Use the voltmeter and ammeter to measure the output voltage and current with different potentiometer values.
- Record the voltage, current and power values in Table 1. Click on the button “Export table to CSV file” to save the data to an Excel file.
- After complete recording the voltage and current values, press the button “Plot IV curve” to plot the current-voltage curve for the solar cell, and press the button “Plot PV curve” to plot the power-voltage curve for the solar cell.
- Identify the maximum power point on the IV and PV curves respectively.

Figure 3: Measurement for IV curve for a single solar cell

- Connect three solar cells in series. Measure the open circuit voltage.
- Connect a potentiometer to the output of the series connection shown in Figure 4. Connect the voltage meter in parallel with the solar cells, and the current meter in series to measure the output voltage and current respectively.
- Vary the value of the potentiometer sequentially according to Table 2. Use the voltmeter and ammeter to measure the output voltage and current with different potentiometer values.
- Record the voltage, current and power values in Table 2. Click on the button “Export table to CSV file” to save the data to an Excel file.
- After complete recording the voltage and current values, press the button “Plot IV curve” to plot the current-voltage curve for the solar cell in series, and press the button “Plot PV curve” to plot the power-voltage curve for the solar cells in series. .
- Identify the maximum power point on the IV curve and PV curves respectively.
- Record the voltage and current characteristic on the plot (x axis is current, y axis is voltage).

Figure 4: Solar Cells in Series.

(C) Solar Cells - Parallel Connection
- Connect three solar cells in parallel. Measure the open circuit voltage
- Connect a potentiometer to the output of the parallel connection shown in Figure 5.
- Vary the value of the potentiometer sequentially according to Table 3. Use the voltmeter and ammeter to measure the output voltage and current with different potentiometer values.
- Record the voltage, current and power values in Table 3. Click on the button “Export table to CSV file” to save the data to an Excel file.
- After complete recording the voltage and current values, press the button “Plot IV curve” to plot the current-voltage curve for the solar cell in parallel, and press the button “Plot PV curve” to plot the power-voltage curve for the solar cells in parallel.
- Identify the maximum power point on the IV and PV curves.

Figure 5: Solar Cells in Parallel.

- Fill out Table 1 with experimental data. Plot the IV and PV curve for a single solar cell. Identify and mark the maximum power point on the IV and PV curves. Write down the voltage, current and power values at the maximum power point.
- Fill out Table 2 for solar cells in series with experimental data. Plot the IV and PV curve for solar cells in series. Identify and mark the maximum power point on the IV and PV curves. Write down the voltage, current and power values at the maximum power point.
- Fill out Table 3 for solar cells in parallel with experimental data. Plot the IV and PV curve for solar cells in parallel. Identify and mark the maximum power point on the IV and PV curves. Write down the voltage, current and power values at the maximum power point.
Contact Us
Virtual Renewable Energy Laboratory
Principal Investigator:Liping Guo, Ph.D.
815-753-1350
lguo@niu.edu
Co-Principal Investigator:
Andrew W. Otieno, Ph.D.
815-753-1754
otieno@niu.edu
The project is funded by the
National Science Foundation
Improving Undergraduate STEM Education program (DUE-1712146)
from June 2017 to May 2020.
